Grad-CAM, Guided Grad-CAM
A summary of insights gained through related papers on Grad-CAM and Guided Grad-CAM. Paper: link
What are Grad-CAM and Guided Grad-CAM?
In short, they are techniques for visualizing the basis of predictions made using CNNs. They are a type of Explainable AI.
For example, if a model predicts that an input image contains a dog, these techniques show specifically which part of the image the model focused on to make the judgment of "dog."
Characteristics of Grad-CAM and Guided Grad-CAM
Explainable AI and visualization techniques for decision rationale are not new to these models.
- weakly supervised localization
- Class Activation Mapping
- Guided Back Propagation
These are examples of prior methods.
So what makes these models different from previous ones, and what are their advantages? There are roughly two reasons.
- Achieving both interpretability and accuracy
- Providing good explanations
1. Achieving Both Interpretability and Accuracy
Typically, when a model is created, its interpretability and accuracy are in a trade-off relationship. The more complex a model is, the higher its accuracy, but it becomes harder to understand why it made a particular prediction. In CNNs as well, more layers generally lead to better predictions, but the internals become increasingly black-boxed. This is not limited to deep learning; it applies to AI in general, including machine learning on tabular data. Of course, there are cases where only improving accuracy is sufficient, but when humans need to make judgments using AI or explain results to others, improving explainability is often necessary. However, since these two are in a trade-off relationship, maintaining both above a certain level simultaneously is difficult.
For example, CAM can only be applied to limited models. Specifically,
Convolutional layers → Global Average Pooling → Final output layer (Softmax layer)
it can only be applied to models connected to the output layer in this form.
On the other hand, Grad-CAM works with any model that uses CNN. It does not matter whether it is an image classification task, an image captioning task, or VQA. Moreover, it can be used without modifying the model architecture.
Therefore, explainability can be improved without sacrificing model accuracy.
2. Providing Good Explanations
This is somewhat broad, but more specifically, it means that good visual explanations of CNN decision rationale can be provided. In this paper, a "good explanation" is defined as one that scores highly on the following criteria:
- Discriminative
- High-resolution
Discriminative (class-discriminative): For example, when a dog and a cat exist in the same image, being able to distinguish between the dog and cat is considered a good explanation.
High-resolution: The finer and more granular the evidence shown, the better the explanation is considered.
As an example, consider the images below. When detecting a cat in the original image, Guided Back-propagation shows the decision criteria at high resolution, but it also highlights the dog simultaneously, so it is not discriminative.
On the other hand, Grad-CAM focuses on the cat and does not focus on the dog, showing it is discriminative, but it lacks resolution.
| Original image | Guided Backprop | Grad-CAM |
|---|---|---|
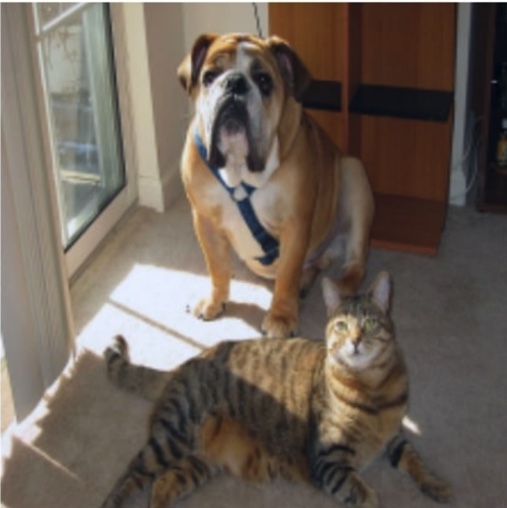 | 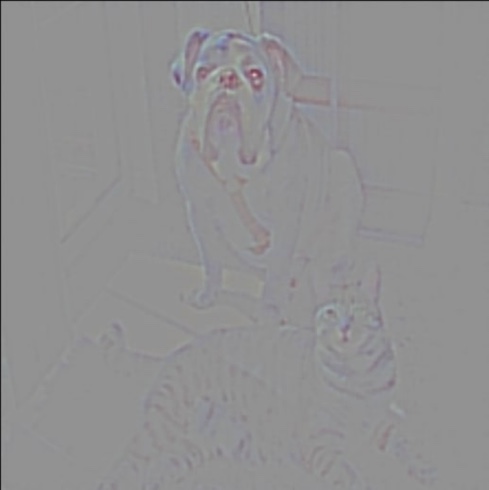 | 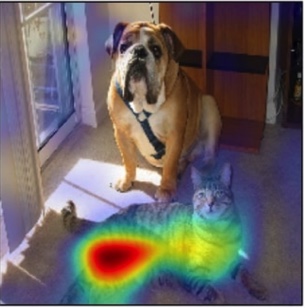 |
Guided Grad-CAM takes the best of both. This method has the high resolution of Guided Back-propagation while being discriminative like Grad-CAM. The results are shown below.
| Original image | Guided Grad-CAM |
|---|---|
| 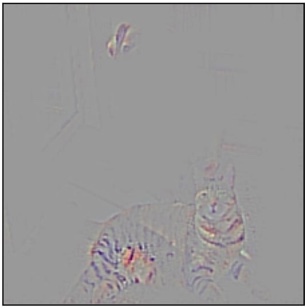 |
As you can see, the decision criteria are shown at high resolution like Guided Back-propagation, while focusing only on the cat.
Applications of Grad-CAM and Guided Grad-CAM
Since these models have high interpretability, they can be applied to various use cases. Here are some application examples.
Explaining the Reasons for Prediction Failures
Since the basis for prediction on a given input image is clearly and visually shown, it is possible to understand why an incorrect prediction was made. Even seemingly inexplicable predictions can be given reasonable explanations.
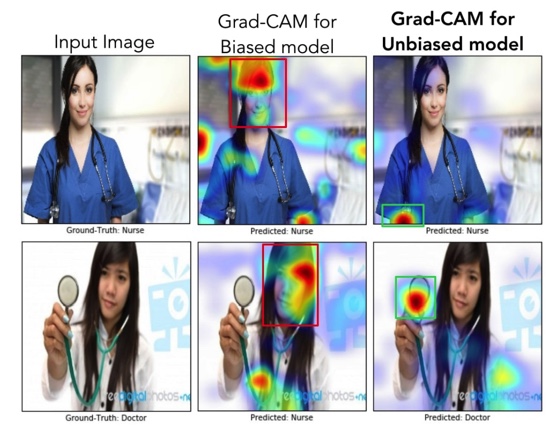
Removing Bias from Datasets
Since the areas the model focuses on during prediction are visually apparent, countermeasures can be taken when the model focuses on areas it should not.
For example, in a task of determining whether a person in an image is a doctor or a nurse, a certain level of accuracy could be achieved simply by determining whether the person is male or female. (This is because there are more male doctors and more female nurses.) In the middle column of the image below, the predictions are based on focusing on faces. The top is a nurse and the bottom is a doctor, yet both are predicted as nurses. However, this is an undesirable (biased) way of making judgments.
Therefore, by providing more images of female doctors and male nurses as input data, it is possible to create a model free from bias.
In the right column, the focus has shifted from faces to belongings and clothing, and correct judgments are being made.
How Grad-CAM Works
Grad-CAM utilizes the spatial properties of the output of convolutional layers within the model to visually represent which parts of the image the model focused on during prediction. Here, the focused areas are where parameters changed significantly during prediction, meaning where the gradients are large. The convolutional layer used here is the output of the very last convolutional layer in the model.
For several classes to predict, let be the prediction score for a certain class c. The average over all pixels in channel k of the gradient of class c at pixel (i, j) of channel k (the degree to which pixel (i, j) in channel k influences the prediction of class c), denoted , can be expressed by the following equation:
Qualitatively, in the above equation can be interpreted as the degree to which channel k influences class c. In other words, it is the importance of channel k when predicting class c. The result of multiplying each channel by this importance (weight) and summing across all channels (weighted sum of all channels), then applying the ReLU activation function, , can be expressed by the following equation:
The reason for applying the activation function is to extract only the positive influences on the score . As can be seen from the equation, this heatmap is single-channel and the same size as the output of the convolutional layer used.