Graph Attention Network Explained
What Kind of Model Is It?
Represents node features not through standard convolution but as a weighted sum of neighboring nodes
---> In short, edge representations are simply expressed as attention weights
It can handle neighborhoods of different sizes while (implicitly) assigning different importance to different nodes within a neighborhood. It does not rely on knowing the entire graph structure in advance, solving many of the theoretical issues of conventional spectral-based approaches. Because edges can be represented simply, computation speed is also reasonably improved.
Objective
Understand GATs (Graph Attention Networks), which have been frequently used in GNNs in recent years.
Prerequisites
Paper available here: ICLR 2018
Background
In graphs, edge information is important in addition to nodes. However, creating latent representations for edges is computationally expensive. -> Represent edges simply using attention weights.
Method
The overview diagram of GATs is shown below.
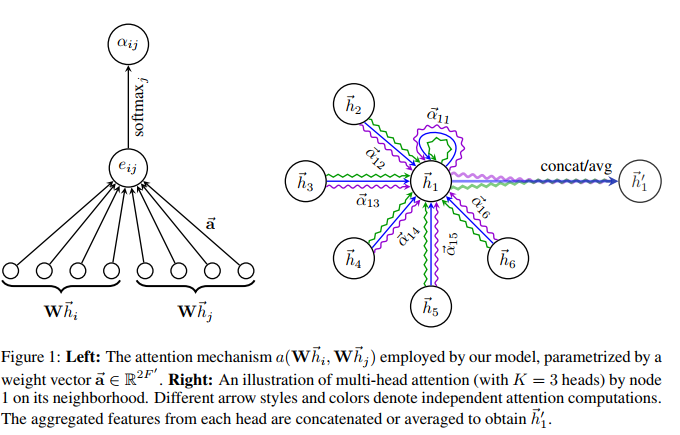
The node update equation is expressed as follows:

In practice, Multi-Head Attention (with K heads) is computed (|| denotes concatenation):

Breaking It Down Further
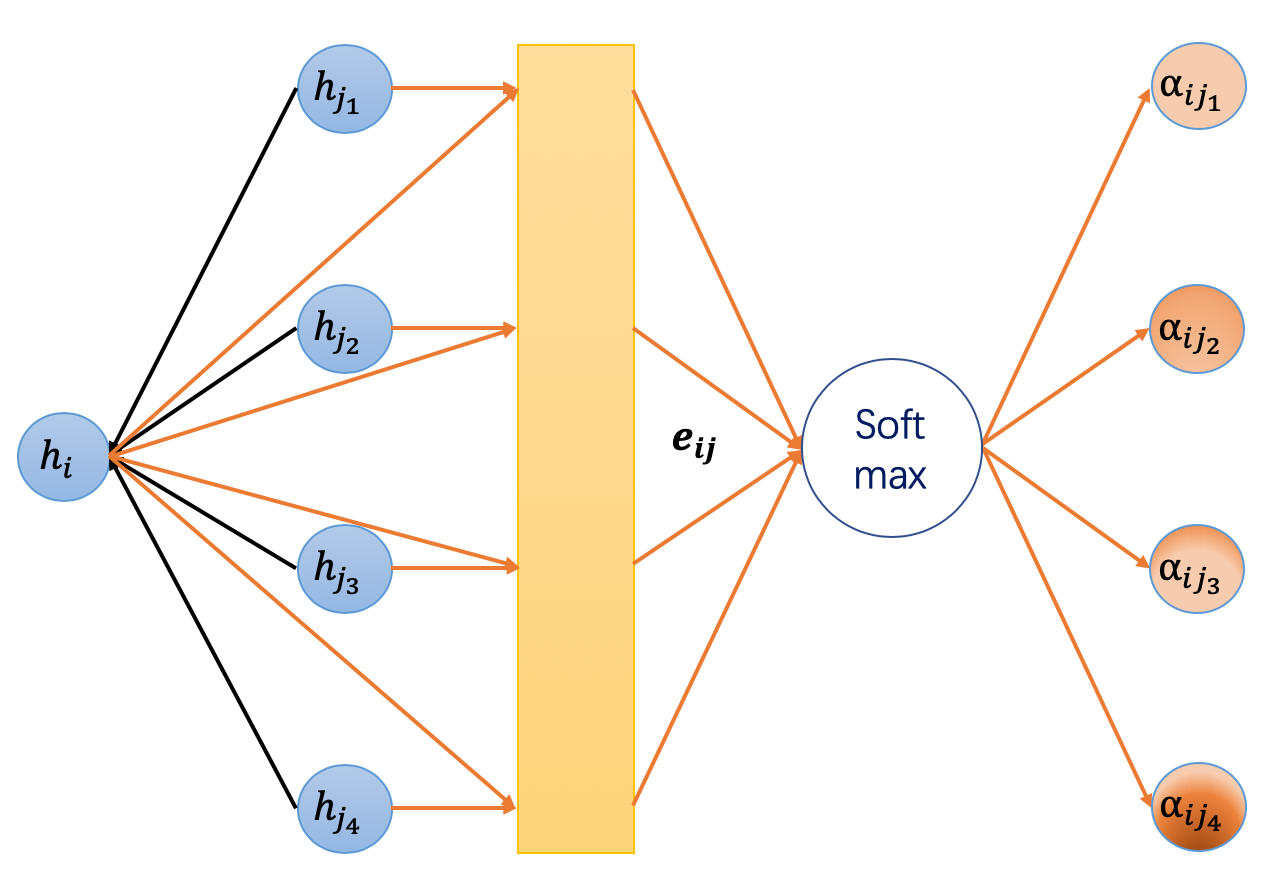
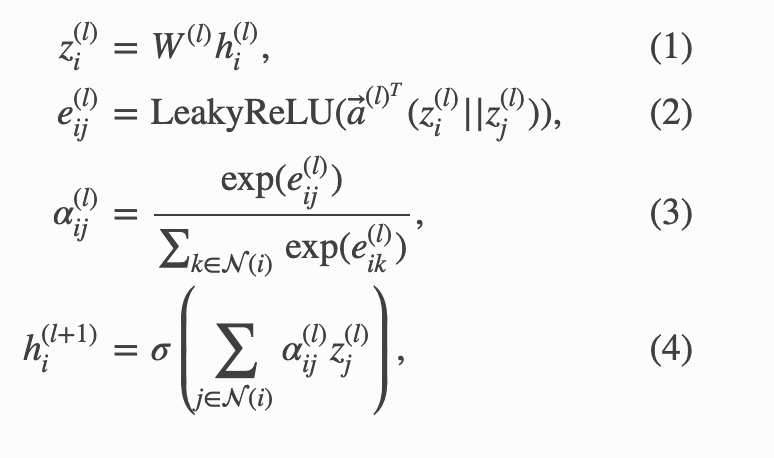
Interpretation of each equation:
(1) Transform the features of node i through a linear layer

(2) Concatenate adjacent nodes i and j (|| in the equation denotes concatenation), then compute the energy function using linear + LeakyReLU
    This is called additive attention, not dot-product attention

(3) Convert to weights

(4) The features of node i at layer (l+1) are represented as the weighted sum of (3) computed via attention and (1)
Experiments
Transductive Learning
The graph used for training and testing is the same (e.g., predicting nodes that already exist but have unknown labels)
- 3 citation network benchmark datasets were used
Inductive Learning
The graph used for training and testing may differ (e.g., predicting new edges or nodes, evaluation on different graphs)
- A dataset representing protein-protein interactions (PPI dataset)
Generally, inductive settings require stronger generalization performance
- Visualization examples
The simple approach of representing strong connections between nodes with large weights is successfully captured
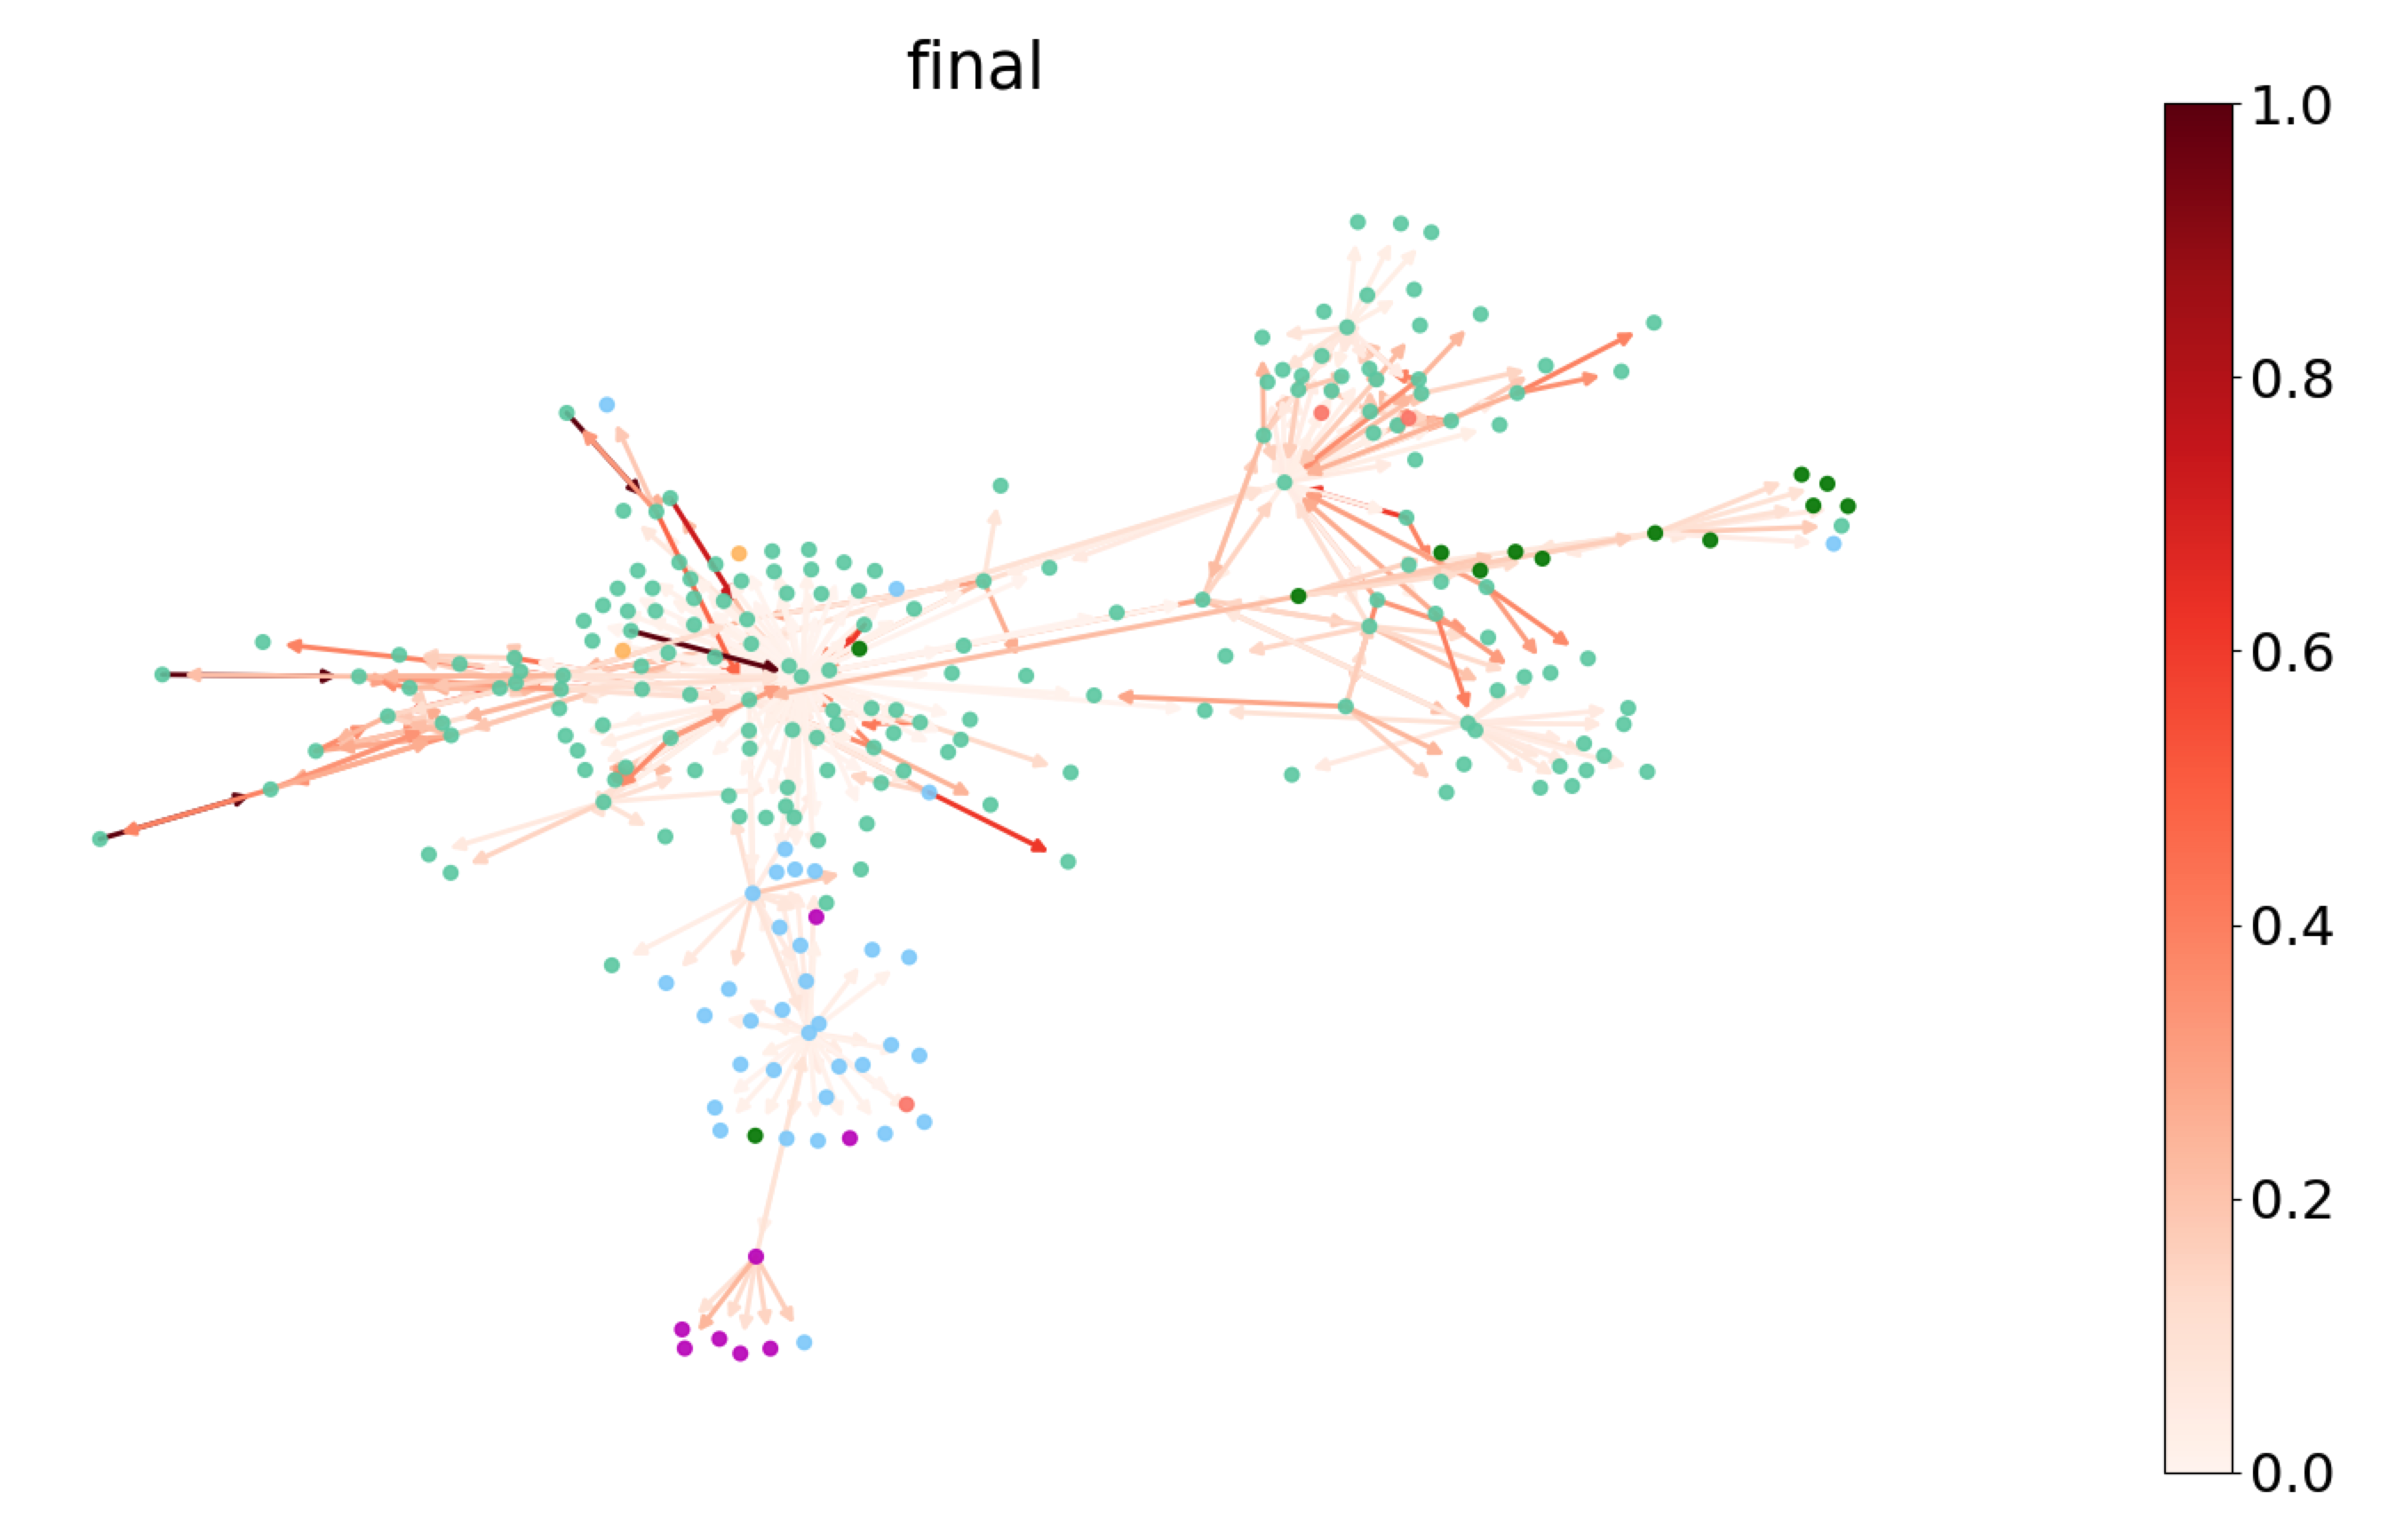
- Visualization of node classification per epoch (as a side note)
References
https://www.slideshare.net/takahirokubo7792/graph-attention-network