A/B Testing and Hypothesis Testing
AB Test with Hypotest
Agenda
- A/B Test Refresher
- Hypothesis Testing
- Common Hypothesis Tests
AB Test
AB Test
- Compares conversion rates between 2 designs
- The most basic method is to compare sample means
Example
-
Compare click-through rates of two designs A and B
- A: visitors, clicks
- B: visitors, clicks
-
Compare sample means
- A:
- B:
-
Therefore, design B has a higher CVR
Question
- Is that conclusion correct?
- With what degree of confidence was that conclusion reached?
- (Statistically) the above conclusion cannot be drawn
Deep Dive Supplement
- Assuming :
Hypothesis Testing
Hypothesis Testing
- A method for statistically verifying whether a hypothesis is correct based on observed values
- Example: To verify whether a coin is fair, flip it several times and observe the results
How to
- State the hypothesis you want to test ()
- Assume the opposite of that hypothesis ()
- Calculate the probability of observing the result under that assumption (-value) *1
- If the -value is very low, conclude that is wrong *2
- In that case, conclude that is correct
Notes
- The -value is precisely "the probability of observing the observed value or a more extreme value under "
- "Very low -value" means lower than the significance level ; commonly or is used.
Example 1
We want to test whether a coin is rigged.
- : This coin is fair -> probability of heads is 50%
- : This coin is rigged -> probability of heads is not 50%
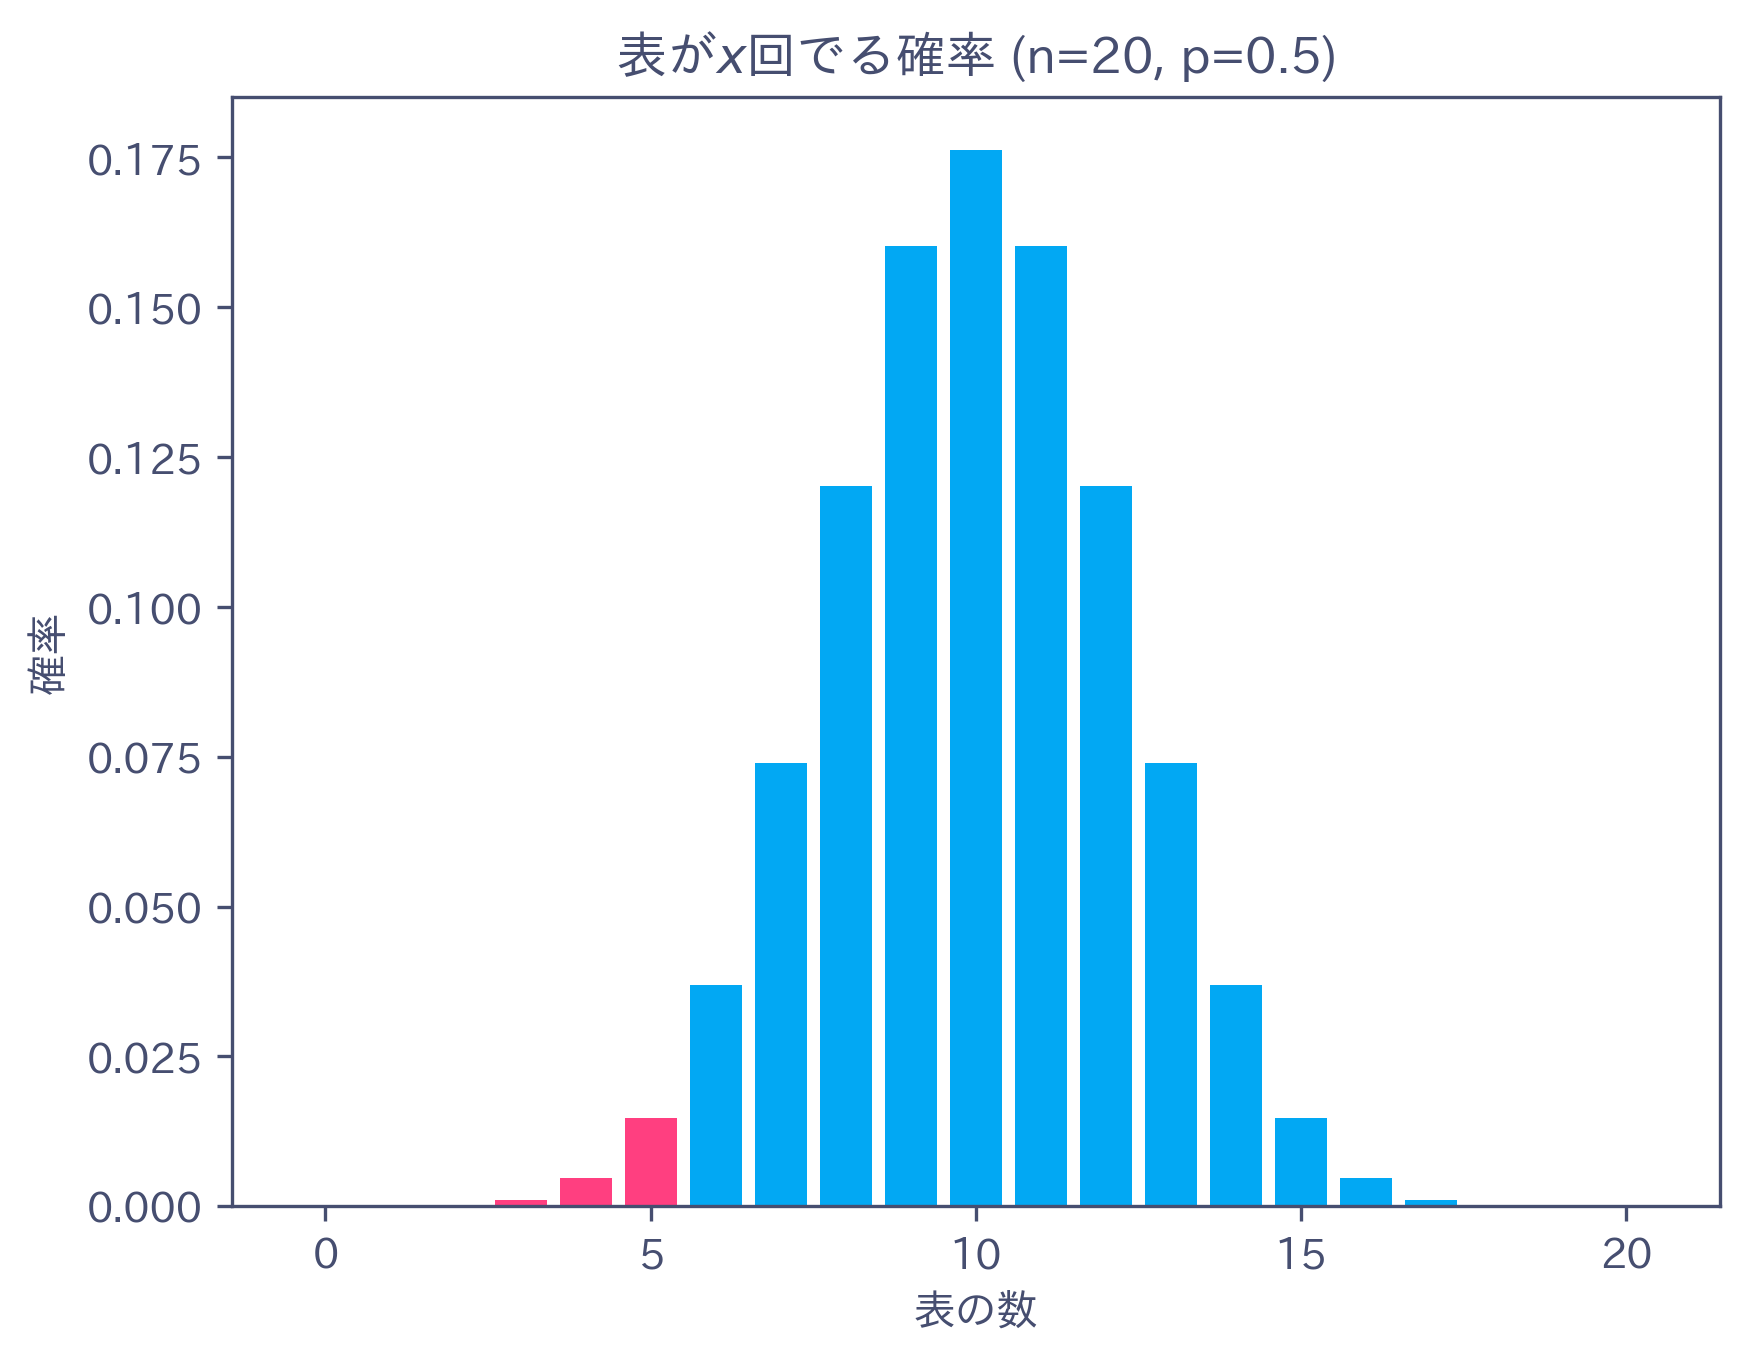
- Observation: Flipping the coin times resulted in heads
Example 2
- Under , the probability of getting heads is as follows:

Example 3
- Calculate the probability of getting or more heads, or or fewer heads
- This is calculated by summing the probabilities from "probability of 15 heads" to "probability of 5 heads" (the red regions in the graph)

Example 4
- Can also be calculated directly
Example 5
- The -value is
- Since it is below , we conclude that the hypothesis is wrong
- Therefore, we reject and accept
-> This coin is rigged
Deep Dive Supplement
Two-tailed Test vs One-tailed Test
- A two-tailed test verifies whether the CVR is exactly a specific value
- A one-tailed test verifies whether the CVR is higher or lower than a specific value
- For , calculate the probability in the left figure; for , calculate the probability in the right figure

Hypothesis Testing for AB Test
Just like coin flips, hypothesis testing can be applied to A/B tests.
- : The CVR of the new design is %
- : The CVR of the new design is higher than %
- -value: The probability of observing the observed number of clicks or more under
Hypothesis Testing for AB Test + 1
Hypothesis testing can also be performed between designs.
- : The CVR of design A and design B are equal
- : The CVR of design A and design B are different
- -value: Calculate the difference between and , and the probability of observing that difference (normal distribution)
Common Hypothesis Tests
Common Hypothesis Tests
- Binomial test (the one we just did)
- Fisher's exact test
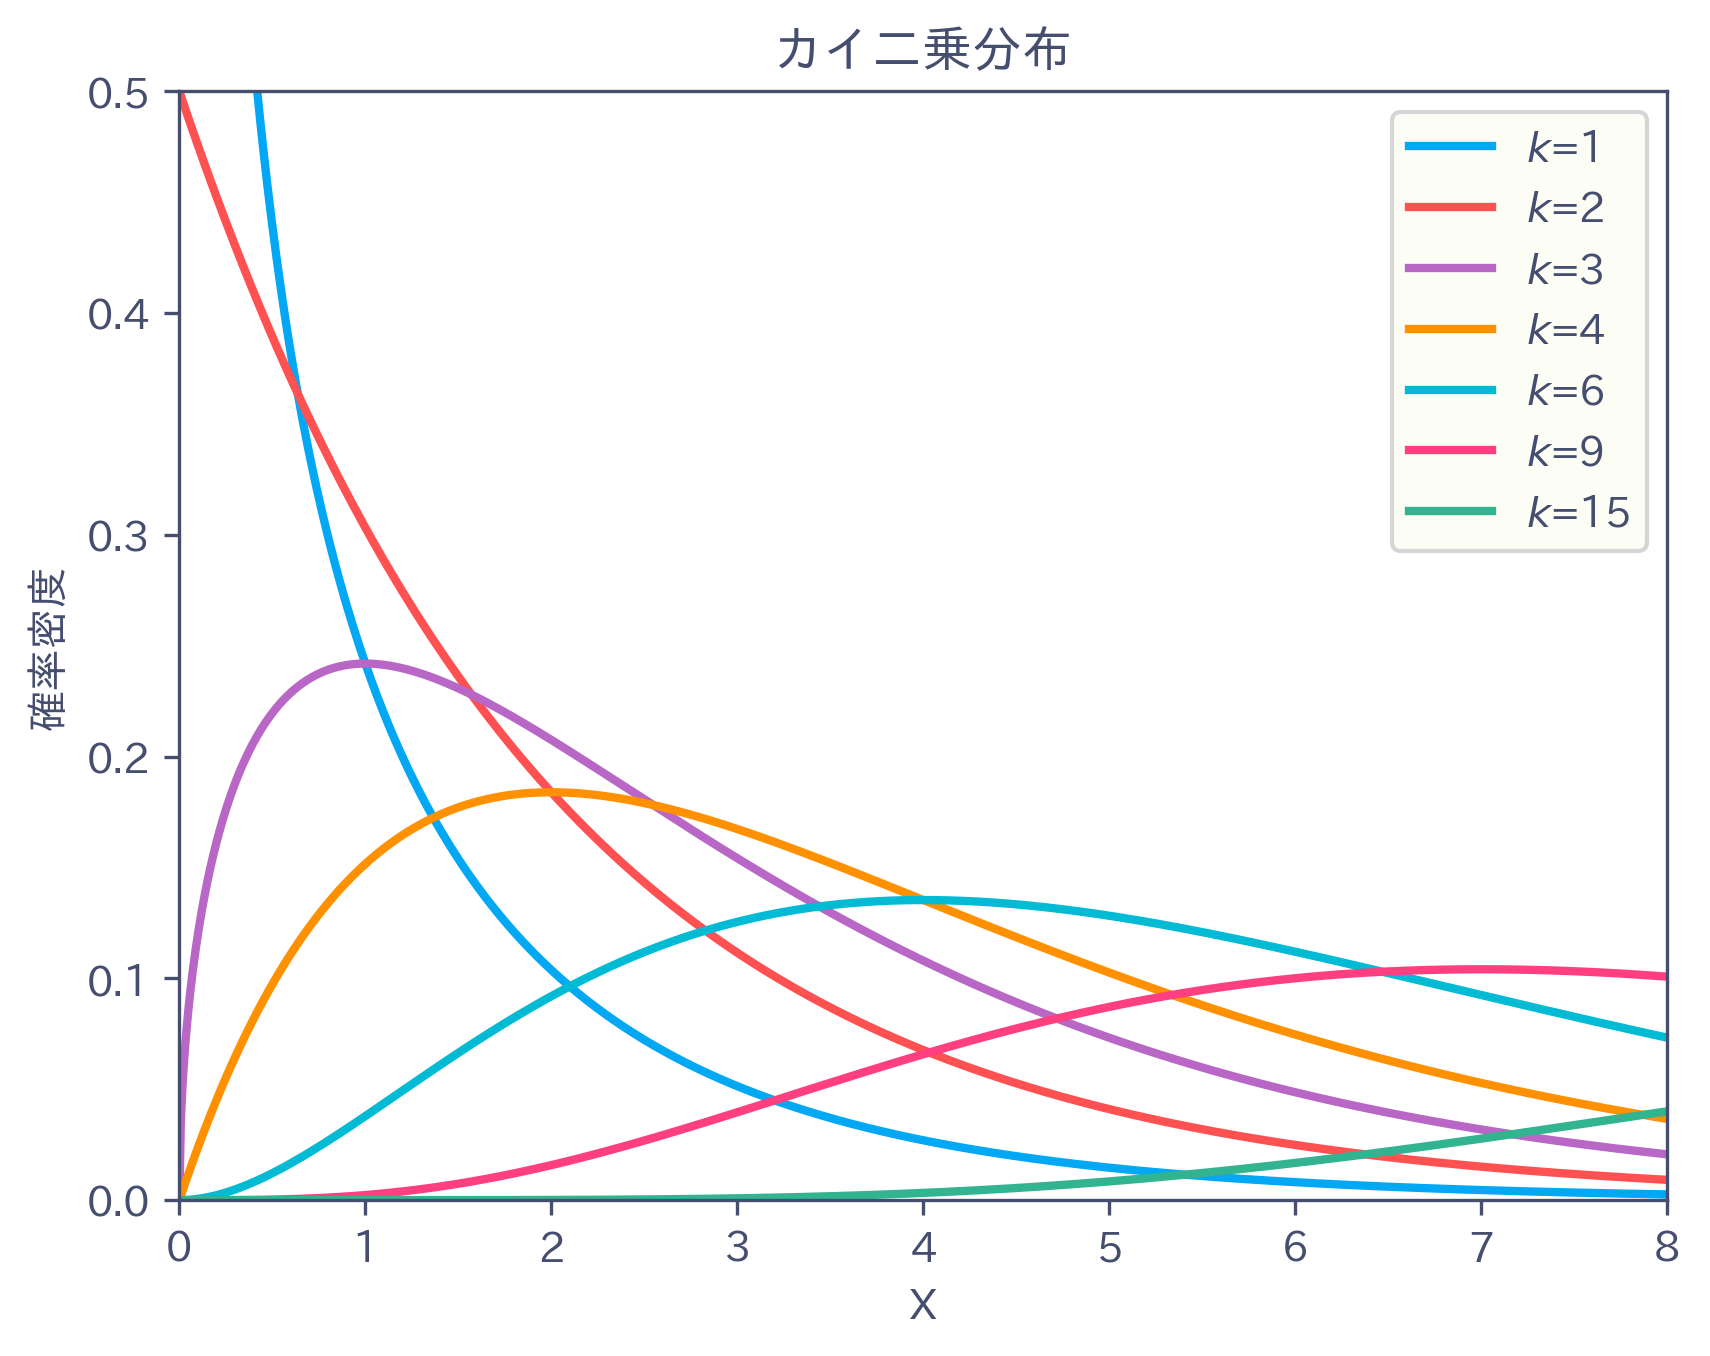
- test
- -test
- Wilcoxon rank-sum test
- -test
We will introduce a few of these.
Binomial Test
- Used for binary "success" or "failure" data such as CVR
- Example: Test whether a design's CVR is
Test
- Used for the same purpose as the binomial test
- Used when the sample size is sufficiently large, approximately
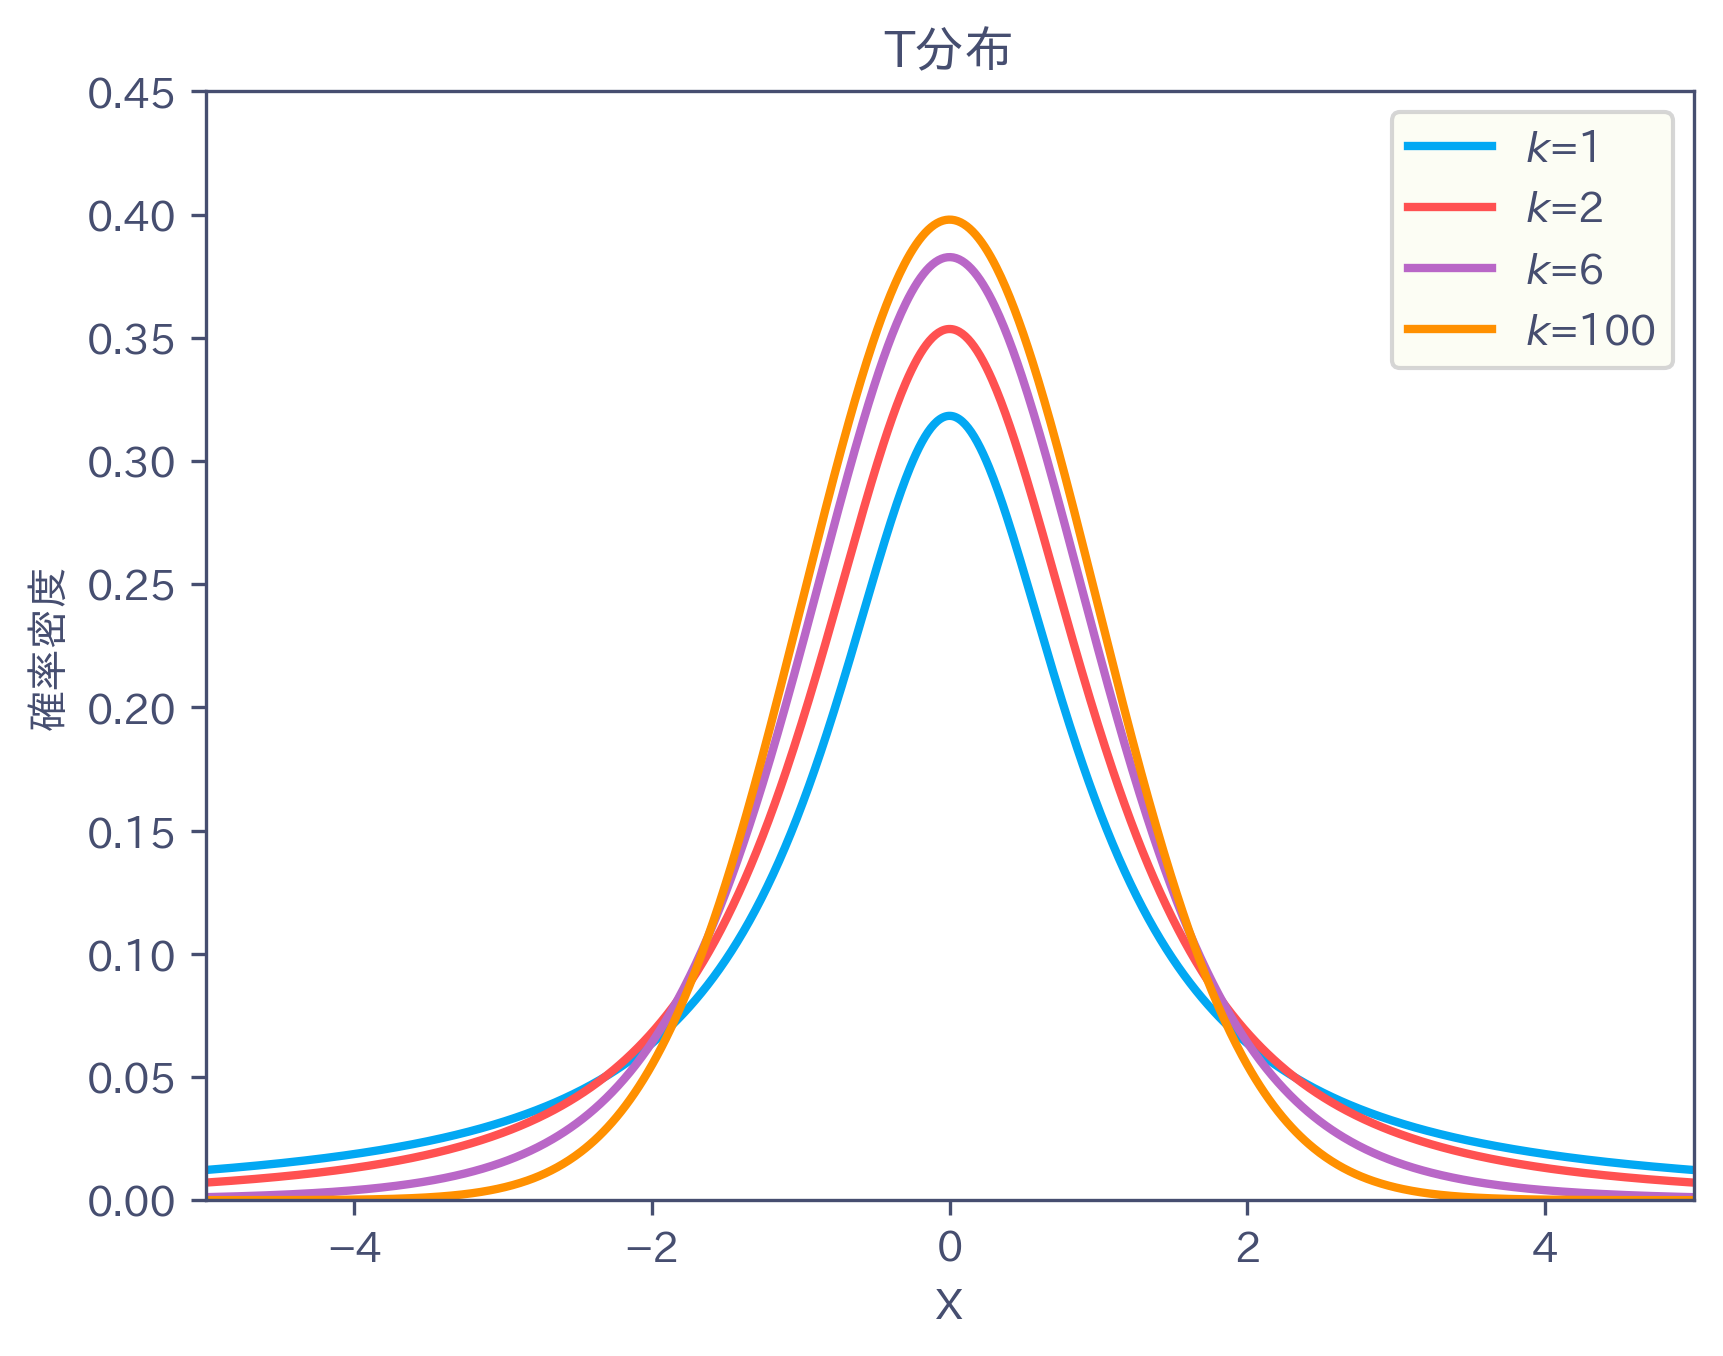
-test
- Can also be used for continuous data
- Tests differences in means
- Example: Test whether the average time spent on a design is seconds
- When data is paired, use the paired -test
Summary
Summary
- Simple analysis can have unexpected pitfalls
- Support decision-making with statistical evidence
- Hypothesis testing is a powerful tool for that purpose
Bonus
Why Do Engineers Need This Knowledge?
- Eliminate subjectivity
- Accelerate the PDCA cycle
- Design systems and databases optimized for user data utilization
- (More details next time) Perform analyses that incorporate domain expertise
Next time, we will present Thinking About A/B Testing with Bayesian Statistics (it is going to be challenging)