Objective
Summarize key points and insights gained while working with tabular data in competitions. Also describe the differences, commonalities, and key points between tabular data and text data, as well as tabular data and image data.
Insights on Tabular Data
EDA (Exploratory Data Analysis)
Observing data and finding relationships within the data to improve performance
- Observations such as "Every time A increases, B decreases..." or "When feature XX is present, feature YY also decreases..." are needed
- From there, you proceed to feature engineering
Feature Engineering
Converting loaded data into a form (numerical values) that machine learning algorithms can handle
- Fill missing values (NaN data) with other values, convert data to numerical values, or create new columns
- Create new features from existing data that are useful for machine learning algorithm predictions
- Reference slides on feature engineering
- Domain knowledge about the field or industry of the competition's data is also very important
- Because it can lead to unexpected useful features
- For example, studying astronomy for a satellite image competition, or researching the fashion industry for a clothing image competition
Understanding How to Handle Missing Values (NaN Data)
- Use missing values as-is
- Fill missing values with representative values
- Fill with median, mean, 0, etc.
- Predict and fill missing values from other features
- Create new features based on whether a value is missing or not
Gradient Boosting and NN (Neural Networks)
- Commonly used by top performers
- For gradient boosting, a method called LightGBM is popular, but there are many other variations
- Sometimes NNs are implemented using PyTorch or TensorFlow
- NNs are particularly popular at present
Hyperparameter Tuning
- Tools like "Optuna" are sometimes used, but there are various other tools as well
- However, the problem is that tuning may not finish in a realistic time frame, and the improvement in score is less than feature engineering
- Since participants often share well-tuned hyperparameters in Notebooks and Discussions, it is best to do this toward the end of the competition
- To emphasize again: feature engineering is more important
Creating Validation Data from Training Data
- By creating validation data and checking scores locally, the validation score can be more reliable than the public LB score
- Because there is a daily limit on the number of submissions
- Validation methods include "Hold-out" and "Cross-validation"
Hold-out Method
A method of splitting training data into, for example, 70% train data and 30% validation data.
Cross-validation
A method of splitting the dataset in different ways multiple times and performing hold-out validation on each split.
- The KFold class from sklearn is convenient
- The benefit of not wasting training data -- all given data can be used for training
- The average score across splits is often taken as the score (CV score)
- Data not used for training in each split is called Out-of-fold
- Depending on how the dataset is split, accuracy can be worse than the hold-out method, so be mindful of the characteristics of the dataset and problem
- Avoid data imbalance where only certain classes exist in training data
- Check for time-series within the dataset
- Check for groups within the dataset
- Reference 1
- Reference 2
Ensemble
A technique that combines multiple machine learning models to obtain higher-performing predictions. There are various methods.
- One technique is "majority voting"
- A method for improving accuracy by having models complement each other's strengths and weaknesses to achieve better overall predictions
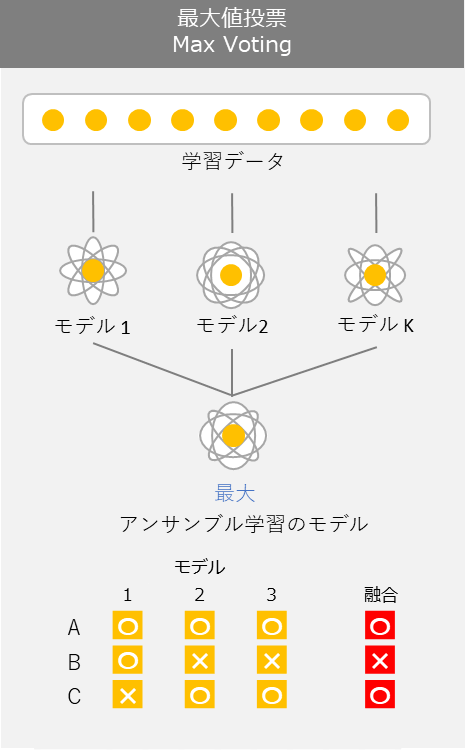
- Generally, the more ensembling you do, the better the score
- Advanced ensembling is sometimes called "black magic"
Participating in a Text Data Competition! Understanding the General Flow
- Start by thoroughly performing EDA to understand the relationships between data
- View data from various angles and obtain features that may contribute to prediction performance
- Carefully perform feature engineering, considering whether to add or remove columns, how to handle missing values, etc. Extremely important!
- Build and train machine learning algorithms
- Save generated weights just in case (especially for large datasets). They may be useful for ensembling later.
- Aim to improve scores from evaluation results
- Hyperparameter tuning
- Time-consuming, so do it toward the end of the competition. Hyperparameter tuning tools are helpful. Not as impactful as feature engineering.
- Revisit feature engineering
- This is where significant changes happen
- Ensemble
- Do toward the end of the competition. Not as impactful as feature engineering.
- Perform cross-validation or hold-out validation
- The number of daily submissions is limited. Don't submit recklessly. Always submit models with reliable scores obtained through proper evaluation.
- Hyperparameter tuning
Insights on Image Data
Similarities with Tabular Data
- As long as it falls within the supervised learning framework, the common element is learning the correspondence between features and target variables in the training dataset with a machine learning algorithm to achieve performance on unseen data
- Image data, like tabular data, is a collection of numerical data
Differences from Tabular Data
-
Feature engineering methods
- Traditional image recognition
- "What to focus on in the image and what to extract as features" => Using local features like "SIFT" and then feeding them into machine learning algorithms like logistic regression
- Similar to the process of creating features from tabular data
- Modern image recognition
- It is now common to let neural networks handle the feature extraction from images
- Image datasets are used directly as input, and neural networks' high representational power acquires useful features
- It is now common to let neural networks handle the feature extraction from images
- Traditional image recognition
-
Given modern feature engineering methods, it is now more common to focus on neural network architecture design rather than feature engineering
-
Deep neural networks (Deep Learning) are often used as machine learning algorithms, and since they are computationally intensive, GPUs are commonly used
-
Dataset sizes tend to be much larger than tabular data
Insights on Text Data
Similarities with Tabular Data
- As long as it falls within the supervised learning framework, the common element is learning the correspondence between features and target variables in the training dataset with a machine learning algorithm to achieve performance on unseen data
Differences from Tabular Data
- Since text cannot be directly handled by machine learning algorithms, it needs to be represented as meaningful vectors, similar to tabular data features
- Text needs to be converted into vectors using some method while preserving the characteristics of the sentences. The conversion methods are described below.
Methods for Converting to Vectors
The following text data is used as an example for explanation.
import pandas as pd

df = pd.DataFrame({'text': ['I like kaggle very much',
                            'I do not like kaggle',
                            'I do really love machine learning']})
print(df)
|     | text                              |
| --- | --------------------------------- |
| 0   | I like kaggle very much           |
| 1   | I do not like kaggle              |
| 2   | I do really love machine learning |
- Bag of Words
- A method that counts the number of words appearing in a sentence
- Weaknesses
- Cannot represent the rarity of words
- Cannot consider the proximity between words
- Discards information about word order in the sentence
from sklearn.feature_extraction.text import CountVectorizer

vectorizer = CountVectorizer(token_pattern=u'(?u)\\b\\w+\\b')
bag = vectorizer.fit_transform(df['text'])
bag.toarray()
array([[0, 1, 1, 0, 1, 0, 0, 1, 0, 0, 1],
       [1, 1, 1, 0, 1, 0, 0, 0, 1, 0, 0],
       [1, 1, 0, 1, 0, 1, 1, 0, 0, 1, 0]])
print(vectorizer.vocabulary_)
{'i': 1, 'like': 4, 'kaggle': 2, 'very': 10, 'much': 7, 'do': 0, 'not': 8, 'really': 9, 'love': 5, 'machine': 6, 'learning': 3}
- TF-IDF
- A method that considers the rarity of appearing words
- Not only counts word frequency, but also multiplies by the inverse of document frequency
- While Bag of Words uses 0 or 1, TF-IDF takes continuous values between 0 and 1. Rarer words receive larger values.
from sklearn.feature_extraction.text import CountVectorizer
from sklearn.feature_extraction.text import TfidfTransformer


vectorizer = CountVectorizer(token_pattern=u'(?u)\\b\\w+\\b')
transformer = TfidfTransformer()

tf = vectorizer.fit_transform(df['text'])
tfidf = transformer.fit_transform(tf)
print(tfidf.toarray())
[[0.         0.31544415 0.40619178 0.         0.40619178 0.
  0.         0.53409337 0.         0.         0.53409337]
 [0.43306685 0.33631504 0.43306685 0.         0.43306685 0.
  0.         0.         0.56943086 0.         0.        ]
 [0.34261996 0.26607496 0.         0.45050407 0.         0.45050407
  0.45050407 0.         0.         0.45050407 0.        ]]
- Word2Vec
- A vectorization method that captures semantic proximity between words
- Understanding Word2Vec with illustrations
- Probably the most concise summary of word2vec (Skip-Gram Model) in Japan
from gensim.models import word2vec

sentences = [d.split() for d in df['text']]
model = word2vec.Word2Vec(sentences, size=10, min_count=1, window=2, seed=7)
Training is now complete. Convert to vectors as follows:
model.wv['like']
array([ 0.04312563,  0.03326133,  0.03106231,  0.01843069,  0.0070821 ,
       -0.02348904,  0.01093288, -0.04240299,  0.02196812,  0.01367226],
      dtype=float32)
Extract similar words from the words used in training as follows. The more data used for training, the better the semantic similarity between words can be learned.
model.wv.most_similar('like')
[('kaggle', 0.22822728753089905),
 ('learning', 0.09379245340824127),
 ('I', 0.0611097514629364),
 ('really', 0.02194378525018692),
 ('love', -0.12185811251401901),
 ('not', -0.13358381390571594),
 ('very', -0.2585296034812927),
 ('do', -0.3249674439430237),
 ('much', -0.37697386741638184),
 ('machine', -0.7193681001663208)]
Using Vectorized Words in Machine Learning Algorithms
1. Take the average of word vectors appearing in a sentence
# Split the sentence into words
df['text'][0].split()
['I', 'like', 'kaggle', 'very', 'much']
import numpy as np
# Vectorize each word
wordvec = np.array([model.wv[word] for word in df['text'][0].split()])
wordvec
array([[-0.00363328, -0.03695147, -0.00932721,  0.02809109, -0.03135956,
        -0.00338274, -0.01236197, -0.01804259,  0.02107921,  0.04571741],
       [ 0.04312563,  0.03326133,  0.03106231,  0.01843069,  0.0070821 ,
        -0.02348904,  0.01093288, -0.04240299,  0.02196812,  0.01367226],
       [-0.01280293,  0.00525372,  0.03063563,  0.02622959,  0.04173809,
        -0.00310447, -0.02303432, -0.01627791, -0.01022275, -0.01953161],
       [-0.02937879, -0.04180092,  0.0457573 , -0.02433218, -0.04171886,
        -0.04713685, -0.04785692,  0.04563756,  0.02717528,  0.00408568],
       [-0.01501628, -0.01051726, -0.03027121, -0.0269054 ,  0.01456141,
         0.00104741, -0.00175865, -0.02849161, -0.03361709, -0.03478765]],
      dtype=float32)
# Calculate the mean of the vectors
np.mean(wordvec, axis=0)
array([-0.00354113, -0.01015092,  0.01357136,  0.00430276, -0.00193936,
       -0.01521314, -0.0148158 , -0.01191551,  0.00527655,  0.00183122],
      dtype=float32)
2. Take the maximum of each element of word vectors appearing in a sentence
# Get the maximum values
np.max(wordvec, axis=0)
array([0.04312563, 0.03326133, 0.0457573 , 0.02809109, 0.04173809,
       0.00104741, 0.01093288, 0.04563756, 0.02717528, 0.04571741],
      dtype=float32)
3. Treat as time-series data of each word
- Treat the word2vec vectors directly as time-series input.
- This is a method that addresses the issue of "discarding information about word order in the sentence"