Evaluation Metrics for Recommendation Systems
A summary of research on performance evaluation of recommendation systems.
Classification and Usage
Regression Accuracy
- Used for predicting user ratings
- Predicting ratings on scales of 1~5 or 1~10
- Can also be solved as a classification problem, but since there is ordinality, it can be solved as a regression problem
- Predicting continuous values is more useful for subsequent sorting, etc.
Classification Accuracy (Mainly Binary Classification)
- Used for predicting whether a user has rated, purchased, or viewed something
- Predicting 0 or 1, like or dislike, did or didn't
List Relevance
- Used for evaluating recommended lists
- Older metrics that consider list ordering but not position
- Consider evaluating a recommendation of 5 versus 4
- In list-based recommendations, items with lower ranks should be weighted relatively higher, but the metrics introduced here cannot make this distinction
- The "Ranked List Relevance" metrics introduced next can distinguish between them (the former scores worse, the latter scores better)
Ranked List Relevance
- Used for evaluating recommended lists
- Newer metrics that consider both list ordering and position
- Impose large penalties for ordering errors at the top of the list
Others
- Newer evaluation metrics used for evaluating recommendation lists and the overall recommendation system
- Item/user coverage rate
- Recommending new items, penalizing recommendations that are not purchased, etc.
- The challenge is that data for evaluation is difficult to obtain
Regression Accuracy
-
Used for evaluating ratings
-
Whether the system has the ability to accurately predict user ratings
-
The difference between evaluation values in test data and predicted evaluation values
-
In evaluation browsing tasks (such as sorting by rating), users see the evaluation values themselves
- In such cases, emphasis should be placed on the prediction accuracy of evaluation values
MAE (Mean Absolute Error)
MSE (Mean Squared Error)
,
- In practice, only the top few items with the highest predicted values are shown to users
- Calculate MAE and RMSE for the top K items (TopK) for evaluation
Classification Accuracy (Mainly Binary Classification)
- Used for binary evaluation such as whether a click or purchase occurred
Accuracy (Acc)
-
The proportion of cases where the user's interest matched between the predicted result and the test data
-
For evaluation values, whether the rating is high or low, etc.
Precision, Recall, F-measure, ROC
- For relevant item discovery tasks where finding one relevant item is sufficient, precision is important
- Measures how few recommendation errors there are
- The proportion of actually relevant items among the top n recommended items
- For relevant item enumeration tasks where all relevant items need to be found, recall is emphasized
- Measures how few recommendation omissions there are
- The proportion of relevant items that are included in the top n recommendations
- For comprehensive judgment, use E-measure, F-measure, or ROC
When alpha = 0.5, this is the F1 score
n-points Interpolated Precision
- Takes the average of Precision at N recall points
- Typically, N=11 (recall 0.0, 0.1, 0.2, ..., 0.9, 1.0)
ROC AUC
where
- takes 1 if , and 0 otherwise
- D0 is the set of negative samples
- D1 is the set of positive samples
Hit-rate
- A metric for targeted unary data (for binary data)
- Search for non-zero entries in the user's test data
- Check if the item is included in the recommendation list
- Calculate the hit-rate
: Number of items included in the recommendation list
: Total number of items across all users
List Relevance Metrics
-
Relatively older ranking metrics
-
Ordering is considered, but the rank position itself is often not considered
Rank Correlation
Spearman's Rank Correlation
: Rank of item i as ranked by the recommendation system
: Rank of item i as ranked by the user
The coefficient can be derived by manipulating the bivariate normal distribution.
- Equals 1 if ranked correctly
- The magnitude of the values does not matter
Kendall's Rank
-
Checks agreement between users regarding the magnitude relationship between two items
-
Total number of pairs is
-
If "User S's rating of A < User S's rating of B" AND "User T's rating of A < User T's rating of B", then P += 1
-
If "User S's rating of A > User S's rating of B" AND "User T's rating of A > User T's rating of B", then P += 1
-
Otherwise, Q += 1, and the following is calculated:
NDMP (Normalized Distance-based Performance Measure)
- C-: Number of contradictory preference relationships
- Cases where the user rates item A > item B, but the recommendation ranks item B > item A
- D-E in the table below
- Cu: Number of identical preference relationships between the recommendation and the user
- B-C, etc. in the table below
- Ci: Total number of preference relationships for item pairs between the recommendation and user rankings
| Rank | Recommend | User |
|---|---|---|
| 1 | A | A |
| 2 | B | B |
| 3 | C | C |
| 4 | D | E |
| 5 | E | D |
Evaluation Metrics for Ranked Recommendations
-
Evaluates how well the recommended items are ordered
-
Whether the N most relevant items are predicted in the correct order
-
When the goal is relevant item discovery, the recommendation system is expected to support decision-making
- In such cases, the magnitude of evaluation should be prioritized over the numerical value
-
It is difficult to obtain a complete ranking from the active user
-
The main issue here is the weighting of the ordering
AP (Average Precision)
- In a ranked recommendation, precision is calculated each time a relevant item is found, and the arithmetic mean is taken
- Here, Prec(r) is Precision, and I(r) is a function that returns 1 if the item at rank r is relevant, and 0 otherwise
- However, this is simply a binary relevance-based evaluation
- In practice, evaluation metrics based on partial or multi-valued relevance are used
MAP (Mean Average Precision)
- For , the average of the top K APs is taken
MRR
- The average of the reciprocal rank of the first relevant item found
- Create recommendation lists for all target users
- Find at what position the first relevant item appears
- Take the reciprocal of this rank (if the list contains no correct answer, use 0 instead of taking the reciprocal)
- Average across all users
- Differences in rank at lower positions have little impact on the metric
CG (Cumulative Gain, without discounting)
- The prototype of DCG
- Sums up the gain (score) of correctly identified items
nDCG (Multi-valued Relevance-based Evaluation Metric)
-
When accumulating the number of relevant items, items ranked lower receive more discounting
- Multiply by coefficients that are larger for higher ranks and smaller for lower ranks, then sum
- This coefficient is called the discounted gain
-
A normalized value of the cumulative discounted gain, where gain represents value based on relevance, and the value decreases as rank gets lower
-
DCG (Discounted Cumulative Gain) is defined below
-
g(r) is the gain at rank r
- Uses the user's actual evaluation values
- Can also be calculated with arbitrary weighting such as 5 points for 1st, 4 points for 2nd, 3 points for 3rd, 2 points for 4th, etc.
-
IDCG is the discounted gain for an ideal recommendation
-
The normalized nDCG is as follows:
ARHR (Average Reciprocal Hit Rank)
- For binary data
: Non-zero items in the user's recommendation list
pos: Position of the item in the ranking
Half-life Utility Metric
- Reduces the importance of items by order using a half-life parameter
: The user u's actual rating of the item at rank j
default: Default evaluation value (usually the mean of evaluation values)
: Parameter controlling the half-life
RBP (Rank Biased Precision)
- Incorporates a user model
: Degree of relevance of the item at rank i to the user's preference
p: Parameter modeling user persistence while browsing the ranked list (usually estimated from click logs)
ERR (Expected Reciprocal Rank)
- Cascade user model
- A model that considers the relevance of items higher in the list
- Users typically stop searching once satisfied
- In this case, everything below the stopping point is not clicked
- One of the cascade models
- Sums the probability that the user stops browsing the recommended ranking at position r
- This probability is influenced by higher-ranked positions
Or alternatively:
g: Degree of relevance to the user's preference
: Maximum grade on the scale (e.g., 5 on a 1-5 rating scale)
Q-measure, GAP (Graded Average Precision)
- An extension of average precision
Non-accuracy Evaluation Metrics
- Metrics that are useful to users but not exploration-oriented
- Coverage, learning rate, confidence, reliability
- Exploration-oriented metrics useful to users
- Measuring whether recommendations are novel to the user
- Serendipity metrics
- Novelty metrics
- Diversity metrics
Useful Non-exploration Metrics
Coverage
- Evaluates how well the recommendation content covers users and items
- In collaborative filtering, predictions cannot be made for items that have not been rated by users
- In content-based filtering, items with missing features cannot be predicted
- There is a trade-off with prediction accuracy
- Recommending items that most customers purchase (such as milk and eggs) increases prediction accuracy but reduces coverage
Catalog Coverage
- How many items can be recommended in a single recommendation out of all available items
- Indicates the breadth of recommended items
- Relevant catalog coverage, which limits the scope of recommendations to relevant items only:
User Coverage
- Indicates how many users out of all target users received recommendations in the most recent recommendation cycle
Learning Rate
- How quickly the recommendation system can provide appropriate recommendations after a user's preferences change
- Related to the cold start problem
- If the system cannot quickly provide appropriate recommendations, user satisfaction decreases
- Time elapsed after preference change
- It is necessary to continuously monitor accuracy from the time a user starts receiving recommendations
Confidence
- How confident the system is in its recommendations
- Calculate how many users and items were used to build the recommendation system
- Data coverage rate at system construction time
- Calculate the similarity of K-NN used in collaborative filtering predictions
- When similarity is low, the K-NN distance becomes large, so this should be monitored
- Calculate how many users and items were used to build the recommendation system
Reliability
- User trust in the recommendation system
- The recommendation system must demonstrate the ability to predict user preferences and interests
- Difficult to gain trust if items familiar to the user are not shown
- If users cannot trust the recommendation system, they will stop using it
- Trust increases when recommendation results are good
- Directly ask users through online evaluation
- Estimate through user usage frequency
Exploration-oriented Metrics
-
If only similar items are recommended, users will get bored with the recommendations
-
Recommending already-known items does not help with decision-making
-
Evaluation targets: user sets, item sets, item pairs, etc.
-
Required data: rating matrix (users x items), ontology (item categories), other novelty/serendipity-related datasets
Cautions
- Recommending only novel items reduces user satisfaction
- Users generally prefer known items
- When evaluated comprehensively, novelty decreases user satisfaction
- Caution is needed when recommending novel items
- Consider the user's experience with the recommendation system
- Explain the novelty of the recommendation system in advance
- Explain each recommended novel item
Serendipity
- Whether the recommendation surprises the user
- (The user cannot search for the item on their own)
- Surprise when a specific item is recommended
- Calculated using other systems?
Unexpectedness
where
Entropy-based Diversity
- Whether items recommended by one system are also recommended by other recommendation systems
Novelty
-
Whether the recommended item is unknown to the user
-
Discovery ratio, Precision of novelty, Item novelty, Temporal novelty, Novelty based on HLU, Long tail metric, Generalized novelty model, Unexpectedness, Entropy-based diversity, Unserendipity, HLU of serendipity
How to Measure
-
Ask about the user's relationship with a specific item
-
Calculate general popularity or similarity between items
-
In the user x item rating matrix, values become 0 or 1 (known or unknown)
Discovery Ratio
- How many items in the recommendation list are unknown to the user
Precision of Novelty
Item Novelty
- Measures the novelty of recommended items
- Uses diversity within the list
Temporal Novelty
- Measures whether recommendations differ from past recommendation lists
Half-life Based Novelty
- Decreases the gain of an item's rating from the normal rating based on a parameter
- Items that are recommended but not purchased have their evaluation discounted
- Half-life evaluation function
- NHLU
Long-tail Based Novelty
- Categorize items into three categories (HEAD, MID, TAIL) based on popularity
- Extract items and from the top N recommendations
- Evaluate the ability to recommend novel items using the following evaluation matrix
| HEAD | MID | TAIL | |
|---|---|---|---|
| HEAD | 45% | 55% | 0% |
| MID | 5% | 70% | 25% |
| TAIL | 0% | 15% | 85% |
- If HEAD→HEAD is large, novelty is low
- An indicator of whether popular items are being rotated
Diversity
-
Whether various types of items can be recommended to users
-
Aggregate diversity, Inter-user diversity, List personalization metric, Gini coefficient, Temporal diversity, Intra-list similarity, Subtopic retrieval, MMR, alpha-nDCG
Aggregate Diversity
-
Diversity of the recommendation system itself
-
Aggregates the types of items recommended to all users
-
A high value indicates that the recommendation system provides different items to users
where
- Some research uses the total item set as the denominator to measure how many items out of all items were recommended to users
- By replacing item types with subcategories/subtopics, category/topic diversity can also be measured (Subtopic retrieval metric)
Inter-user Diversity
- Diversity across users
- A mechanism for providing different recommendations to different users
- How well the recommendation system is personalized for individual users (IUD)
List Personalization Metric
- Whether the list is optimized for individuals
Gini Coefficient
- Used as an indicator of income inequality, etc.
- How biased the recommendation frequency of items is
- x-axis: Percentage x% of items arranged in order of total frequency in the recommendation list
- y-axis: Total frequency of x% of items in the list
Temporal Diversity
- Measurement when the system outputs different items at different times
where
Intra-list Diversity
- Diversity based on the content of the recommendation list
- Calculated using the similarity between two items
- Typically, feature vectors or categories are used
where : list of items recommended to user
MMR (Maximal Marginal Relevance)
- Originally a document selection method for search results
- This concept is applied to evaluate recommendation result lists
where
Notes on Recommendation System Evaluation Metrics
- AP and nDCG can evaluate ranked recommendations for specific users
- When evaluating a system, it is necessary to evaluate the average quality across multiple users
MAP
- The arithmetic mean of AP over a set of N users
- MAP alone is insufficient when the goal is to present reasonably relevant recommendations to as many users as possible
GMAP (Geometric Mean AP)
For convenience, this can be transformed into the following form:
Where epsilon is a very small value (around 10^(-5)):
When recommendations for some users contain no relevant items, GMAP evaluates lower than MAP.
- When the measurement range is short (e.g., top 10), MAP and GMAP values tend to be unstable
infAP (Inferred Average Precision)
- Estimates the true average precision from incomplete test collections
Policy-based Evaluation Metrics
- Distribution of specific item attributes
- When there are categories to promote, evaluation can be based on the distribution of specific attributes of the provided items
- Frequency of NG item appearances
- The goal is basically 0
- Transition rate to target items/categories
- Measured when controlling where users navigate to
- Gini coefficient of page views per item
- Measured to see if bias is corrected when introducing mechanisms to prevent item view bias by the system
Interleaving
- Alternately present new and old algorithms and evaluate which one receives better responses
- https://www.wantedly.com/companies/wantedly/post_articles/155593
- Can evaluate significant differences between algorithms more than 10 times faster than A/B testing
- Useful when the impact is small
Industry Status in 2017 (RecSys 2017 Conference)
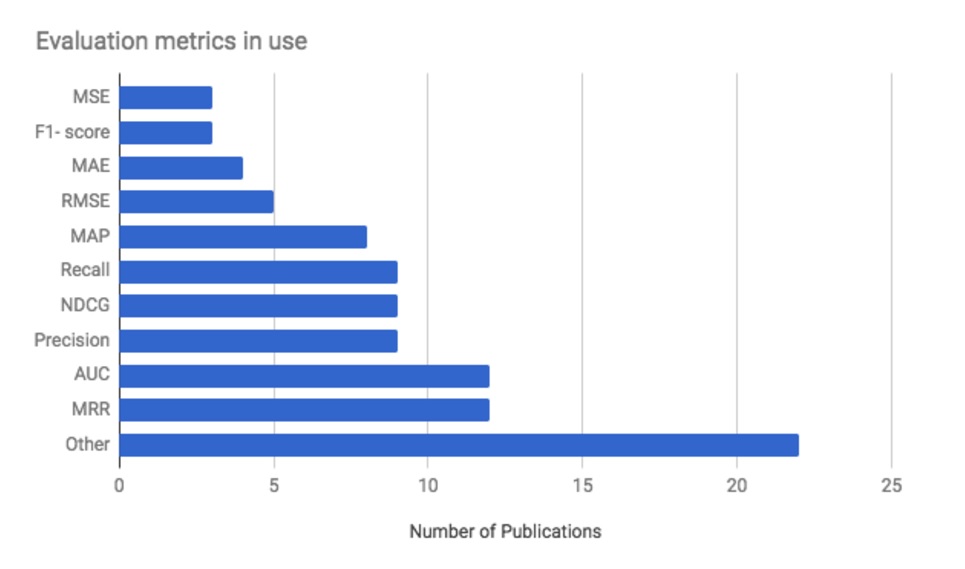
- At the recommendation systems conference, the metrics used by companies as of 2017, in order of frequency:
- MRR (ranked recommendation list metric considering ordering, weighted by reciprocal of rank)
- AUC (classification problem)
- Precision (finding one relevant item)
- nDCG (ranked recommendation list metric considering ordering, with adjustable weights)
- Recall (enumerating all relevant items)
- Although exploration-oriented evaluation metrics have been proposed in papers, in real environments the answer data is difficult to obtain, and they are not widely used in practice yet.
- MRR and nDCG are relatively newer methods but are widely used.
References
- About recommendation systems: http://www.kamishima.net/archive/recsysdoc.pdf
- About evaluation metrics: https://techblog.nhn-techorus.com/archives/4778
- Evaluation methods and metrics for search/recommendation: https://qiita.com/rilmayer/items/4c2c40640c0892e13257
- Classification of evaluation metrics: https://blog.brainpad.co.jp/entry/2017/08/25/140000
- Offline evaluation of recommendation systems: http://soc-research.org/wp-content/uploads/2014/11/OfflineTest4RS.pdf